













 +9 pp vs 2024




Governance
Strengthening the sustainability framework and its six strategic pillars.nEnvironment

Sustainability Report 2025
A year shaped by global instability.
A growth that never stopped.
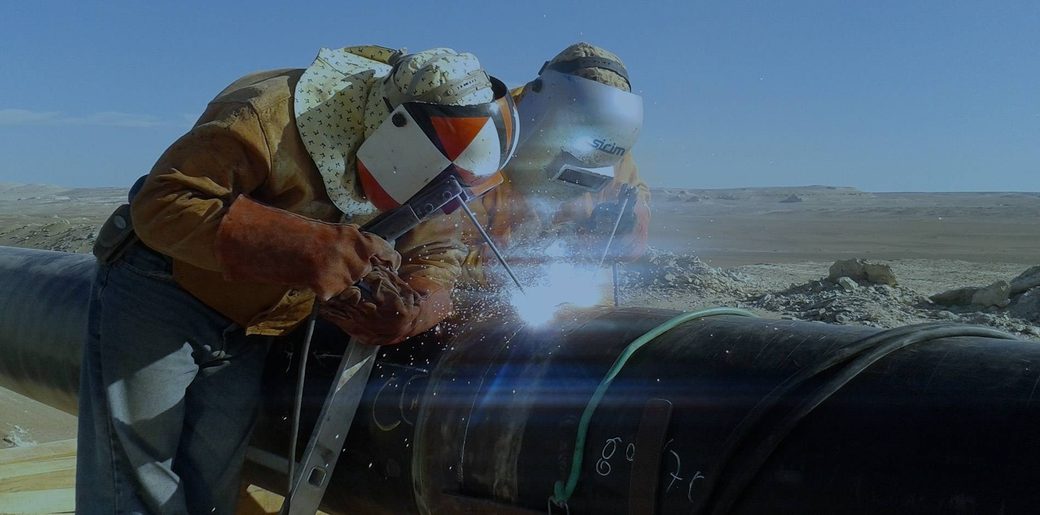
In a global context marked by conflicts, instability and profound transformations, SICIM has continued to grow, strengthening its project portfolio and its presence in strategic energy markets. Sustainability is not a separate track from this growth — it’s the strategic lever we use to navigate complexity, drive change, and turn an industrial approach into continuous cultural evolution. This page walks through what that meant in 2025: for our people, for the environment and the communities where we operate.
2025 at a glanceThe year in numbers
190,654 MWh energy consumed
-14%
Group emission intensity for 2025
(ratio of Scope 1 and Scope 2 – Location-Based – emissions to net revenue)
↓
63.36 tCO2e/million €
6.841
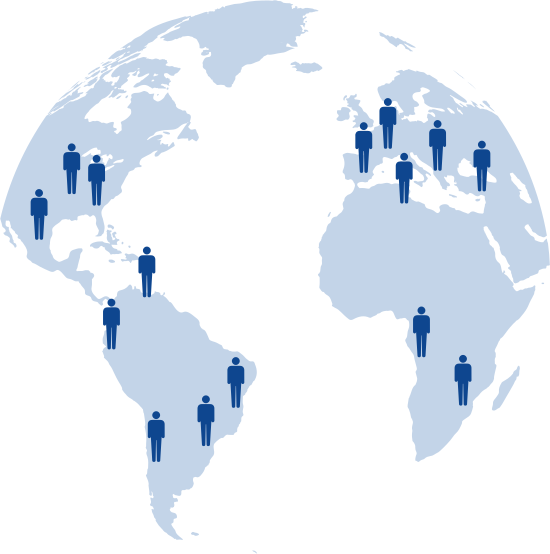
people worldwide
25.53%
of turnover Taxonomy-eligible
Average client satisfaction
7.77 /10
0
cases of corruption and bribery
01 — To our stakeholders
In 2025 we secured a number of significant new contracts. Large-scale projects were progressed across multiple regions worldwide — such as Kazakhstan, the Middle East, Europe and the Americas. In Italy, we carried out upgrading works on gas-fired power stations and progressed the development of part of the Adriatic Line.
Growth, for SICIM, has never meant standing still: even in a year shaped by conflict and instability, we kept strengthening our project portfolio and our presence in strategic energy markets around the world.
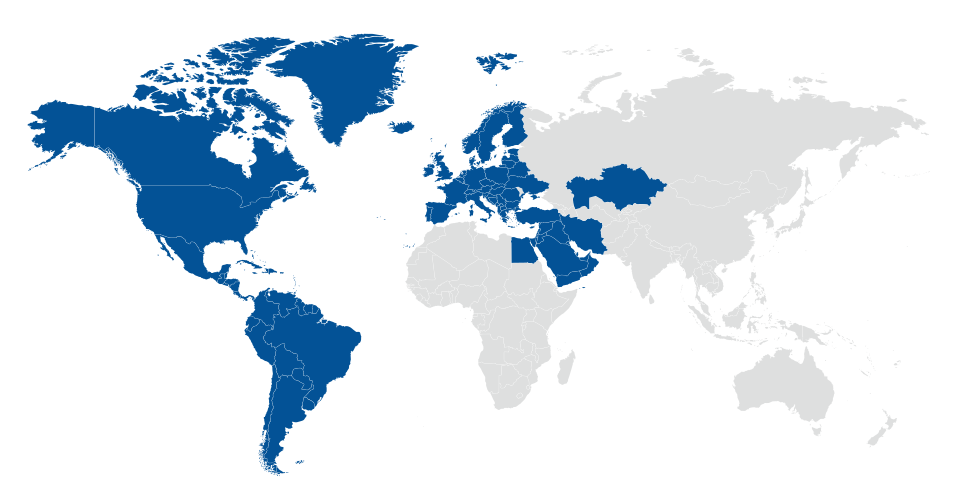
Sustainability is not a separate track from this growth — it is the strategic lever we use to navigate complexity, drive change, and turn an industrial approach into continuous cultural evolution.
02 — Our value model
SICIM’s value creation model is based on a synergy between quality, client focus and the ability to innovate.
High standards of quality, safety and environmental protection are maintained throughout the entire project lifecycle through a Multisite Management System aligned with ISO 9001, ISO 45001 and ISO 14001 — the same three certifications that underpin how we run every site, everywhere we operate.
Our objective is not only to deliver measurable results, but also to continuously strengthen the processes that generate them.
This means systematically listening to clients, investing in research and development, digitalising operations and embedding innovation into day-to-day activities, so that improvements become scalable and repeatable across projects.
This approach is reflected in the evolution of our client satisfaction model. In 2025 we introduced a new 1–10 rating scale, enhanced the survey methodology and digitalised the feedback collection process, enabling more timely and meaningful insights to support continuous improvement.
7.77/10
average client satisfaction
on the new 1–10 rating scale introduced in 2025
Research & Development
A continuous improvement
Reduction in GHG emissions
75%
compared to the diesel configuration when using grid electricity
65,500 litres/year
of diesel saved
Reduction in noise emissions
10 dB(A)
from 112 to 102 dB(A)
Additional benefit
Improved working conditions and operator comfort
A digital attendance-tracking system that standardises data collection, accelerates information sharing and expands the availability of operational data for project management and performance analysis
Research & Development
Results achieved
15
projects using the digital tracking system
~7.7 million hours
worked recorded digitally
5,900
workers monitored
Over 61,000
digital reports collected
drone-based aerial surveying, enabling faster, safer and more comprehensive data collection, together with the continued digitalisation of surveying activities
In focus
In 2025 we expanded our use of aerial photogrammetric surveying systems using drones.nnDrone surveying offers significant advantages in terms of data collection speed, greater coverage of the surveyed areas, data completeness and reduction in manual fieldwork. The use of drones also generates operational safety benefits, as it reduces the need for personnel to be present in vast, inaccessible or congested areas.
Aerial photogrammetric surveying and digitalisation of surveys recorded data
67
active users
8
managed sites
1,648
surveys carried out
436
designs uploaded
8,163
measurements created
Sites with the highest intensity of use
870+
surveys
185
designs
Over 4,900
measurements
03 — People
Our workforce grew again in 2025, across seven countries and a wide range of professional profiles. Growth brings responsibility: on safety, on training, and on the conditions in which people work every day.
Our workforce
4,739 90%
men
5,262
employees worldwide
+10.6% vs 2024
523 10%
women
Across Kazakhstan, Iraq, Saudi Arabia, Italy, Mexico, Peru and Guyana
People are the condition of everything else: no project stands without the competence and the safety of those who build it.
04 — Environment
Total energy consumption fell by 18% compared with 2024, driven by the ISO 50001 Energy Management System, fleet retrofitting and the adoption of HVO biofuel.
Energy and emissions
190,654 MWh
total energy consumption
-18% vs 2024
driven by the ISO 50001 Energy Management System, fleet retrofitting and HVO biofuel adoption
12%
from renewable sources
3% in 2024
↓
reflecting new photovoltaic installations and renewable electricity contracts (GO-certified). This increase is principally due to the usage of biofuels (HVO) which has grown by 207%.
88%
fossil fuels remains the Group’s primary energy source
29,729 kWh
electricity generated by photovoltaic systems at worksite
Scope 1 + 2
(Location-Based)/net revenue
Scope 1 + 2
(Location-Based)/hours worked
Both improvements stem from the combined effect of energy efficiency initiatives and the renewable electricity supply contracts.
Water consumption
361,005 m³
withdrawn
+4% vs 2024*
increase mainly due to a broadened reporting scope, not higher actual use
74,737 m³
discharged
-76% vs 2024
result of the vehicle-washing recirculation system and hydrotest water recycling + other water recycling mechanisms described)
Hydraulic testing accounts for ~11% of total consumption thanks to water recycling mechanisms
75%
of total consumption is due to water stress
Materials, waste and recovery are tracked at corporate level through the JD Edwards ERP system. The decrease in hazardous waste reflects tighter operational controls upstream.
Resource inflows and outflows
Total materials used at corporate level, tracked via JD Edwards ERP
121,768
tonnes
Reused or recycled secondary components
22.48%
+9 pp vs 2024
reflecting the circularity measures under the Waste Management procedure
Waste
up vs 2024, mainly non-hazardous waste
135,841
tonnes
Hazardous waste
down 76%
reflecting tighter prevention and control measures
10%
of waste sent for recovery
(a decrease vs 2024)
61%
of recovered waste is recycled
60%
of waste (hazardous and non-hazardous) sent to other disposal operations, followed by landfill and incineration
05 — Communities
SICIM’s presence in the Busseto area is long-standing, and the support given to sporting, cultural and social initiatives is part of how the company understands its role there.
Community impact
Over €150,000
invested to support sporting, cultural and social initiatives in the Busseto area
SROI = 2.76
on the Breast Cancer Awareness Day initiative
(€2.76 of social return for every €1 invested, driven by preserved working hours, avoided healthcare costs and avoided travel emissions)
16
employees reached through cancer prevention services
80
working hours preserved
273.6 kg
of CO2 emissions avoided from travel
Measurable value
The value of these initiatives is measurable: the Breast Cancer Awareness Day in Italy alone preserved 80 working hours (valued at €2,352, based on €29.4/hour) and generated an estimated €2,080 in avoided healthcare costs through early diagnosis, while also avoiding 273.6 kg of CO₂ emissions from travel — together producing a Social Return on Investment (SROI) of 2.76.
06 — Governance
The Group’s governance rests on a Code of Ethics, an anti-corruption framework and a sustainability framework built on six strategic pillars.
0
confirmed cases of corruption or bribery
60 days
standard payment terms
Zero confirmed cases of corruption or bribery in 2025.
Payment terms to suppliers remain at a standard 60 days.
07 — EU Taxonomy
A quarter of SICIM’s turnover is Taxonomy-eligible, almost entirely from the construction of Hydrogen-Ready pipelines.
25.53%
of turnover Taxonomy-eligible, from Hydrogen-Ready pipeline construction
This figure is attributable to the construction of Hydrogen-Ready pipelines.
1.75%
Taxonomy-eligible CapEx
Primarily relates to investments in EV charging infrastructure, photovoltaic systems and the company’s Euro 5–Euro 6 compliant vehicle fleet.
08 — Future steps
Strengthening the sustainability framework and its six strategic pillars.nEnvironment
 Integrity and transparency
 Beyond carbon
 Nature and resources
 Value creation
 People and communities
 Health and safety
A year shaped by global instability.A growth that never stopped.